BI: BI and Graph Charts
What's BizForecast BI?
BizForecast BI is a function module for companies that use our BizForecast Series. It compiles and analyzes any data that are managed in BizForecast Series, or use imported data from other systems if necessary, to generate simulations and support your business decision-making.
Use BizForecast BI with the user-designed report output function, which is one of the BizForecast's standard functions (Core Module), to help you create valuable reports in a timely manner and make speedy and right decisions.
System Overview
BizForecast BI carries an advanced multi-axis analysis function by pivots and OLAP. It's also equipped with visual tools that can create a wide variety of graphs and charts. There's also a dashboard function, which lets you combine these functions and customize a dashboard for every user. You can use any data managed in BizForecast, search and extract data with complex conditions, define data sources for analysis, and create pivots and graphs. To analyze data that are not managed in BizForecast, the data linkage function, one of the standard functions (Core Module), is available.
BizForecast BI lets you create pivots, then save or export them as Excel files that contain pivot tables. All graphs and charts can be saved as images as well.

Function Overview
1. Dashboard Function
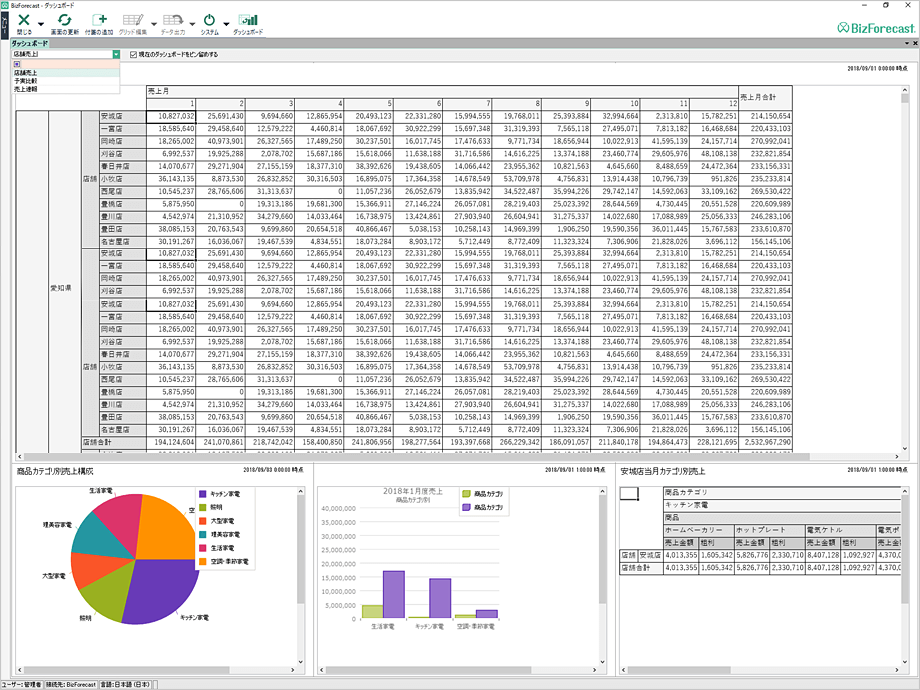
(1) Dashboard Display
The dashboard function lets each user customize what pivots, graphs, or charts to display right after logging in, so that business performance and status can be evaluated quickly at a glance.
For example, by displaying a pivot, you will understand the performance summary and then quickly move to view a detailed breakdown of accounts with significant increases or decreases.
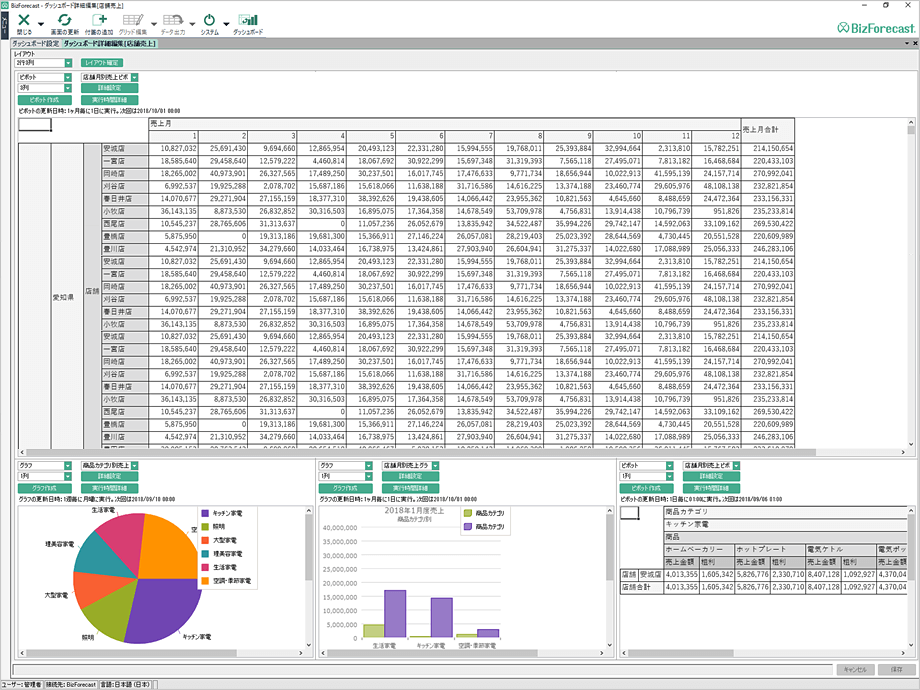
(2) Settings and Customization
You can design a dashboard in detail by choosing which control types (pivots, graphs, or charts) to display, how they should be laid out, and what data sources or search conditions to use for each control.
Once customized, you can define and set access authorities individually to dashboard layouts, thereby controlling available dashboards for each user to use.
2. Pivots⁄OLAP Function
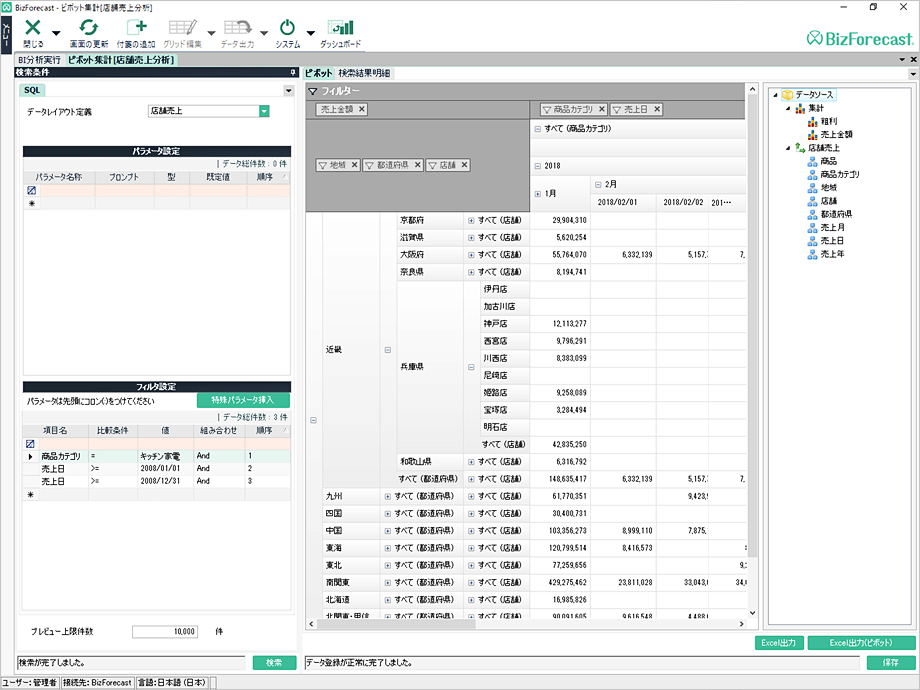
This advanced pivot analysis function lets you search and extract any data in BizForecast under complex conditions and analyze them in various ways, such as combining multiple datasets or adding a tree system as an analysis axis.
The operations are similar to the Excel pivot table functions. Any data sources or analysis axes you set in BizForecast can be exported as Excel files with pivot tables.
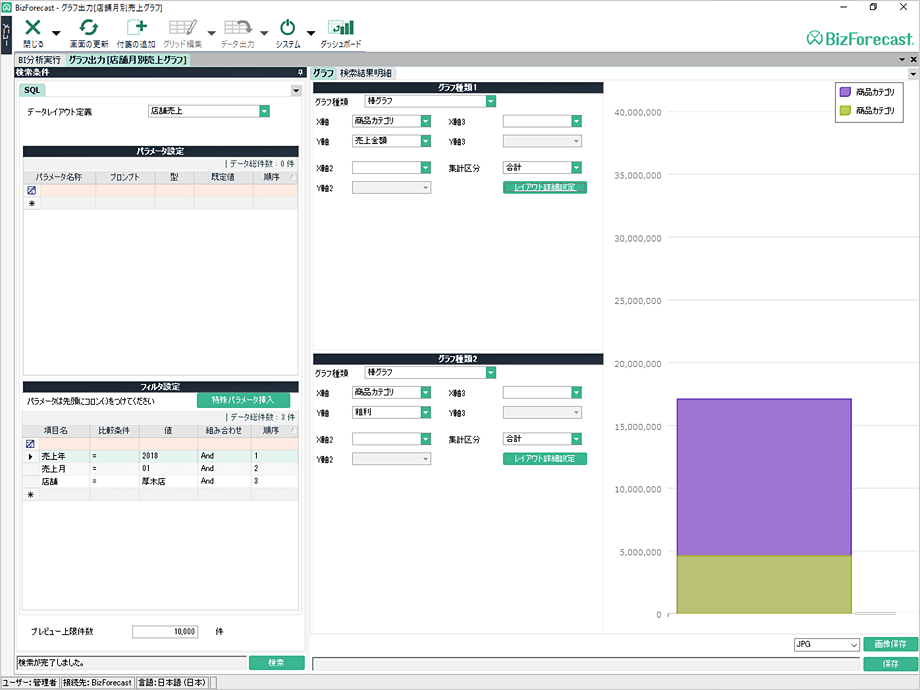
3. Graph⁄Chart Function
You can define data sources as with the pivot⁄OLAP function, and use the graph/chart function to select graphs or charts among 14 different types to visualize your data.
You can overlay multiple 2D graphs, define up to three X and Y axes respectively, and customize graph titles, memory width, or colors in detail. All graphs and charts can be exported as images, such as PNG and JPG.